Introduction
In this article, a structural causal model (SCM) for generating $J$ letters is given. Almost half of the $J$ letters are capped. “Capped” means that there is an almost horizontal line piece at the top of the letter. The other half of the letters are uncapped. The directed acyclic graph (DAG) of this SCM was proposed in [1]. Using this SCM, $J$ letters are generated. Since every detail of each $J$ letter is known, no image processing algorithm which is either signal processing based or machine learning based or deep learning based is needed for determining the parts or details of the letters. This is the main reason for creating such an SCM. The SCM helps to concentrate on the verification of the DAG proposed in [1]. There are four features in the SCM. Three of them are $28 \times 10$, $28 \times 9$ and $28 \times 9$ pixel blocks or can be created from these pixel blocks. The fourth one is the letter’s name.
The Structural Causal Model
The structural causal model contains three endogenous variables as $E$, $F$ and $G$. $E$, $F$ and $G$ are the $28 \times 10$ image part, the $28 \times 9$ image part and the $28 \times 9$ image part, respectively. These variables are shown in the Figure 1. The fourth endogenous variable is $I$ which denotes the name of the letter.

The DAG of the image is given in the Figure 2.

The causes of the variable $E$ are $I$ and the exogenous variable $U_{E}$. $E$ contains the cap of the $J$ letter if it is a capped one and part of its vertical part. $I$ determines which probability distribution is to be sampled to get $E$. The exogenous variable $U_{E}$ adds noise to $E$. This noise can be considered to be due to causes like writing styles varying from person to person and pen tips. The following Python code snippet draws the cap of the letter $J$ if it is capped.
sample_cap_length = sample_right_n - sample_left_n + 1
seed1 = 41+theIndex
size1 = sample_cap_length-1
seed2 = 51+numOfSamples+theIndex
random_deviations = randomDeviations(seed1, size1, seed2, p_zero_dev_m)

cap_mn_array = np.zeros((sample_cap_length, 2), dtype=int)
im, cap_mn_array = drawCap(
    im, cap_mn_array, sample_cap_length, sample_initial_point_m,
    sample_right_n, random_deviations
)
The following Python code snippet draws the vertical part of the variable $E$.
var_E_ver_part_length = variable_E_height-vertical_start_m
seed1 = 81 + 4*numOfSamples + theIndex
size1 = var_E_ver_part_length
seed2 = 91 + 5*numOfSamples + theIndex
pZero = p_zero_dev_n
random_dev = randomDeviations(seed1, size1, seed2, pZero)

vertical_E_mn_array = np.zeros((var_E_ver_part_length, 2), dtype=int)
drawnArray = vertical_E_mn_array
drawActLength = var_E_ver_part_length
initial_m = vertical_start_m
initial_n = vertical_start_n
randomDevs = random_dev
im, vertical_E_mn_array, current_m, current_n = drawVertical(
    im, drawnArray, drawActLength, initial_m, initial_n, randomDevs)
So, the Python code snippet implements the following part of the SCM: \begin{equation} E = f_{E}\left (I, U_{E} \right) \label{SCMEqn1} \end{equation} The second equation of the SCM is given in the equation \eqref{SCMEqn2} as follows: \begin{equation} F=f_{F} \left(I, E, U_{F}\right) \label{SCMEqn2} \end{equation} If the image is considered as a matrix, then the starting column of the variable $F$ is a function of the variable $E$. It is the mean of the column numbers of the variable $E$. $I$ determines how this part of the letter is drawn, almost a vertical line segment is namely drawn for the case of the letter $J$. $U_{F}$ stands for the noise due to causes like writing styles varying from person to person and pen tips. The second equation of the SCM given in the equation \eqref{SCMEqn2} is implemented by the following Python code snippet:
seed1 = 101 + 6*numOfSamples + theIndex
ver_start_m_F = variable_E_height
var_F_ver_part_length = variable_F_m_upper_bound+1-ver_start_m_F
size1 = var_F_ver_part_length
seed2 = 111 + 7*numOfSamples + theIndex
pZero = p_zero_dev_n_F
random_dev = randomDeviations(seed1, size1, seed2, pZero)

ver_start_n_F = (np.round(np.mean(vertical_E_mn_array, axis=0)[1])).astype(int)
drawnArray = np.zeros((variable_F_height, 2), dtype=int)
drawActLength = var_F_ver_part_length
initial_m = ver_start_m_F
initial_n = ver_start_n_F
randomDevs = random_dev
im, vertical_F_mn_array, current_m, current_n = drawVertical(
    im, drawnArray, drawActLength, initial_m, initial_n, randomDevs)
The variable $G$ contains an almost vertical line segment followed by the hook of the letter $J$. The starting column of the variable $G$ is a function of the variable $F$. It is the mean of the column numbers of the variable $F$. The length of the almost vertical part in $F$ is always constant at 9. However, the length of the almost vertical part in $E$ is always varying. Hence, $G$ variable effectively depends on this varying length. In order to draw a beautiful $J$, the longer the vertical part and the longer the cap is, the larger the part of the variable $G$ occupied by the hook should be. That is why the following relation is programmed:
if (samples[theIndex] == 1):
    ver_stop_m_G = (np.round(
        27-0.35*sample_cap_length-0.20*var_E_ver_part_length
    )).astype(int)
else:
    ver_stop_m_G = (np.round(27-0.40*var_E_ver_part_length)).astype(int)
The hook of $J$ is to be modelled by means of a parabola. Some terms related with parabola can be defined using the drawing in the Figure 3.
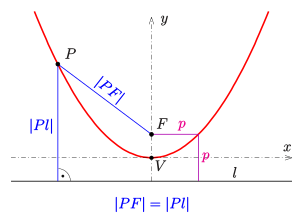
$V$ is the vertex and $F$ is the focus of the parabola. The line $l$ is the directrix of the parabola. Any point on the parabola has the property that its distance to the focus is equal to its distance to the directrix. In a more general situation different from the one given in the Figure 3, let the vertex, focus and the directrix be given as follows: \begin{gather} V\left(v_{1}, v_{2}\right) \newline F\left(v_{1}, v_{2}+f\right) \newline y=v_{2}-f \end{gather} Then, the equation of the parabola can be written as follows [3]: \begin{equation} y=\frac{1}{4f} \left(x-v_{1}\right)^{2}+v_{2} \end{equation} The bottom left-hand corner of the image is chosen as the center of the $x-y$ coordinate system and the image is assumed to be in the first quadrant of the $x-y$ plane while drawing the parabola which represents the hook of $J$. The coordinates of the vertex $V$ are functions of the length of the almost vertical part of the variable $E$ and the length of the cap if $J$ is capped. The related Python code snippet is as follows:
if (samples[theIndex] == 1):
    v_x = (np.round(
        hook_start_n-(0.25*sample_cap_length+0.1*var_E_ver_part_length)
    )).astype(int)
else:
    v_x = (np.round(
        hook_start_n-(0.3*var_E_ver_part_length)
    )).astype(int)

if (v_x < 0):
    v_x = 0

if (samples[theIndex] == 1):
    v_y = (np.round(27-
        (1.0*sample_cap_length+0.5*var_E_ver_part_length))).astype(int)
else:
    v_y = (np.round(27-
        (1.0*var_E_ver_part_length))).astype(int)

if (v_y <= hook_start_m):
    v_y = hook_start_m + 1
As the length of the vertical part of the letter $J$ or its cap length increases, the width of the hook should become larger for a good-looking letter. That’s the reason for the functional mapping from the almost vertical length of $E$ and the cap length to the vertex coordinates. The same logic is employed in determining the stop point of the hook as follows:
if (samples[theIndex] == 1):
    hook_stop_n = (np.round(
        v_x-(0.4*sample_cap_length+0.21*var_E_ver_part_length))).astype(int)
else:
    hook_stop_n = (np.round(
        v_x-(0.6*var_E_ver_part_length))).astype(int)

if (hook_stop_n <= 0):
    hook_stop_n = 0
By means of the related snippets of the Python code, the third equation of the SCM which is given by \begin{equation} G=f_{G}\left(I, E, F, U_{G}\right) \end{equation} is implemented.
The complete Python code and the generated $J$ letters are on this link.
Conclusion
A structural causal model for the generation of $J$ letters have been outlined. The link to the Python code and the generated letters have also been given.